The State of Dining 2026
We read the room so you don't have to. TastyPals editors analyzed 3,321 restaurants across 12 North American cities— which cuisines dominate, which dishes keep showing up on the plates worth ordering, and where each city's dining energy is concentrated right now.
- restaurants analyzed
- 3,321
- cities
- 12
- top cuisine
- Italian
- most-named dish
- Butter Chicken
Most-reviewed cuisines
Italian leads our editorial coverage, followed by Japanese and American.
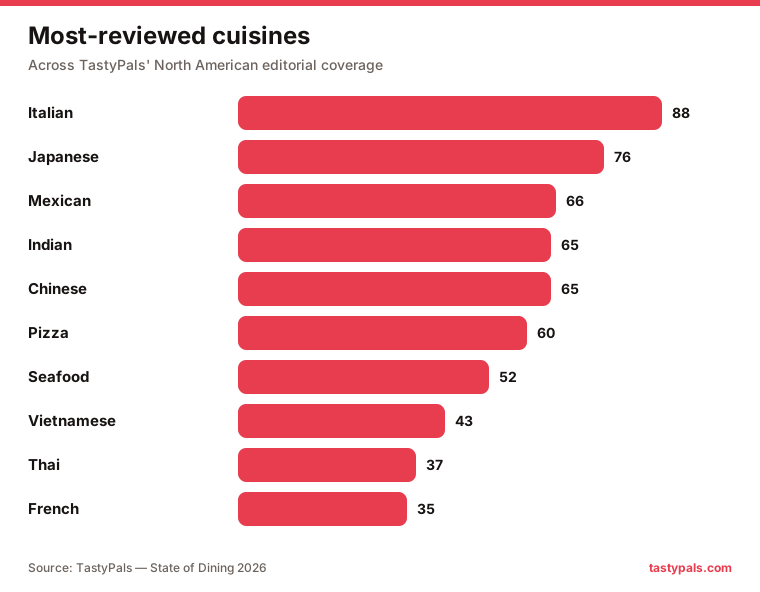
<a href="https://tastypals.com/research/state-of-dining-2026" target="_blank" rel="noopener"><img src="https://tastypals.com/research/state-of-dining-2026/top-cuisines.svg" alt="Most-reviewed cuisines across North America — TastyPals State of Dining 2026" width="720" style="max-width:100%;height:auto;border:0" /></a>Source: TastyPals — The State of Dining 2026 · free to use with a link back.
Most-named dishes on menus
Butter Chicken is the single most-cited signature dish across our reviews — ahead of Pad Thai and Tiramisu.
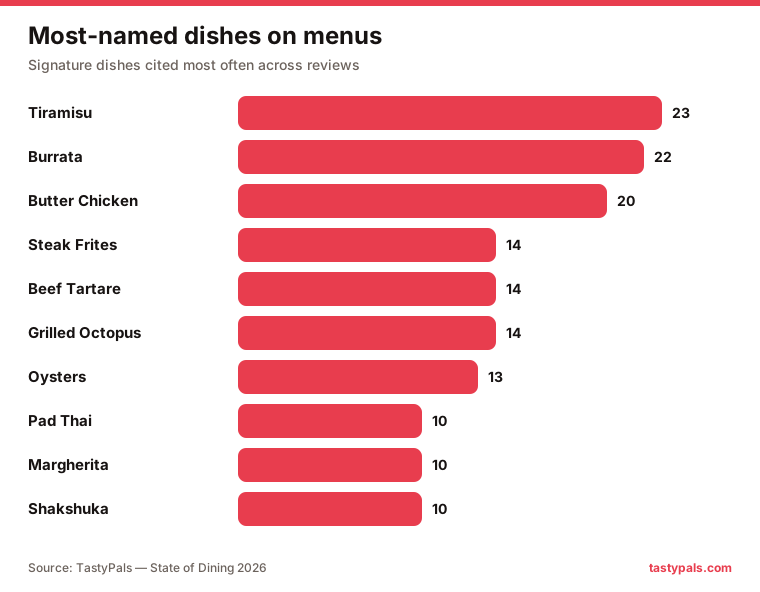
<a href="https://tastypals.com/research/state-of-dining-2026" target="_blank" rel="noopener"><img src="https://tastypals.com/research/state-of-dining-2026/top-dishes.svg" alt="Most-named signature dishes — TastyPals State of Dining 2026" width="720" style="max-width:100%;height:auto;border:0" /></a>Source: TastyPals — The State of Dining 2026 · free to use with a link back.
Reviewed restaurants by city
Toronto has our deepest coverage, with 472 reviewed restaurants.
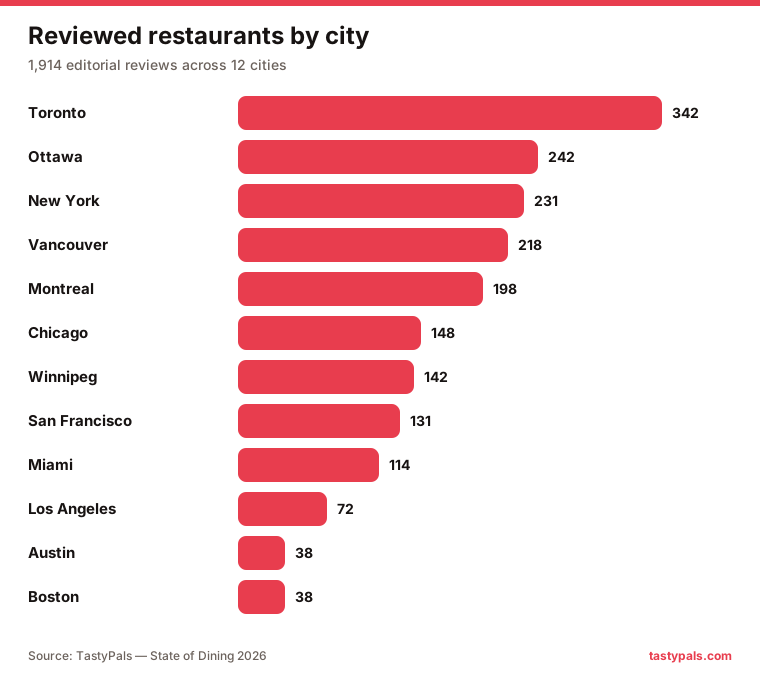
<a href="https://tastypals.com/research/state-of-dining-2026" target="_blank" rel="noopener"><img src="https://tastypals.com/research/state-of-dining-2026/reviewed-by-city.svg" alt="Reviewed restaurants by city — TastyPals State of Dining 2026" width="720" style="max-width:100%;height:auto;border:0" /></a>Source: TastyPals — The State of Dining 2026 · free to use with a link back.
Top cuisines by coverage
Share of the 2,488 restaurants we've tagged with a cuisine.
- 1. Italian269(11%)
- 2. Japanese194(8%)
- 3. American141(6%)
- 4. Mexican136(5%)
- 5. French119(5%)
- 6. Indian116(5%)
- 7. Chinese108(4%)
- 8. Thai106(4%)
- 9. Pizza103(4%)
- 10. Seafood94(4%)
Most-named dishes
Share of the 3,321 reviewed restaurants that name each dish.
- 1. Butter Chicken42(1.3%)
- 2. Pad Thai37(1.1%)
- 3. Tiramisu30(0.9%)
- 4. Steak Frites28(0.8%)
- 5. Burrata25(0.8%)
- 6. Beef Tartare23(0.7%)
- 7. Grilled Octopus22(0.7%)
- 8. Lamb Chops21(0.6%)
- 9. Shakshuka18(0.5%)
- 10. Chicken Tikka Masala17(0.5%)
City by city
Coverage depth and the signature cuisine + dish for each city. Explore any city's full guide.
How much it costs
Catalog-derivedSecondary data from our restaurant catalog (price tier and Michelin recognition), across 3,321 reviewed spots. These are catalog signals, not editorial headline stats.
7.2% of the restaurants we cover carry Michelin recognition (239 spots).
Methodology
Primary stats are computed from 3321 TastyPals editorial reviews that match a catalog restaurant, across 12 cities. Reviews without a catalog match are excluded.
How we normalize the data
- Cuisine counts exclude non-cuisine buckets (e.g. Contemporary, Global, Restaurant, Bar, Fusion).
- Dish names are counted case-insensitively; the most common spelling is displayed.
- Catalog-derived figures (price, Michelin) come from the Supabase catalog and are labeled as such — they are secondary and may be incomplete.
Caveats
- This reflects TastyPals editorial coverage, not a census of every restaurant in each city.
- Coverage depth varies by city, so cross-city comparisons should be read as coverage, not absolute market size.
Generated July 23, 2026 · Source: TastyPals editorial reviews · How we review
Citing this report
Writers and journalists are welcome to cite these figures and embed the charts above — please credit TastyPals — The State of Dining 2026 with a link to this page. Questions or a custom cut of the data for your city? Email hello@tastypals.com.