San Francisco dining in 2026
What our editors found across 239 reviewed San Francisco restaurants— the cuisines that dominate the city's tables and the dishes that show up most on the plates worth ordering.
- reviewed restaurants
- 239
- avg editorial score
- 8.2/10
- top cuisine
- Italian
- signature dish
- Oysters
Most-reviewed cuisines in San Francisco
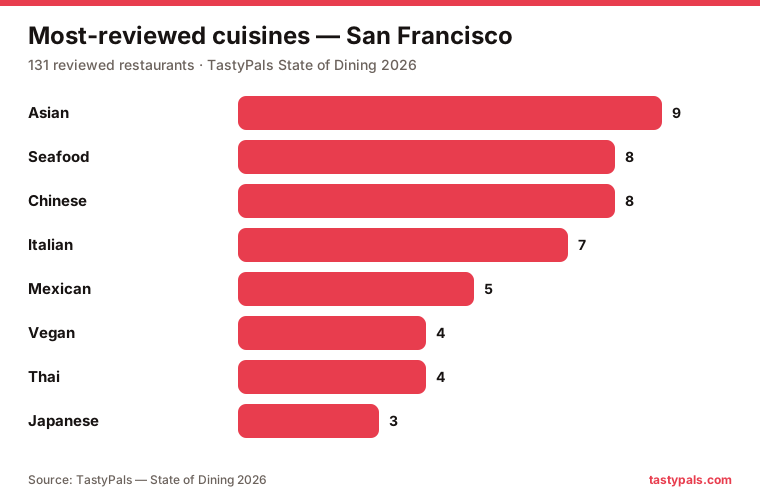
<a href="https://tastypals.com/research/state-of-dining-2026/san-francisco" target="_blank" rel="noopener"><img src="https://tastypals.com/research/state-of-dining-2026/cities/san-francisco-cuisines.svg" alt="Most-reviewed cuisines in San Francisco — TastyPals State of Dining 2026" width="720" style="max-width:100%;height:auto;border:0" /></a>Source: TastyPals — San Francisco Dining 2026 · free to use with a link back.
Top cuisines
Share of the 202 San Francisco restaurants we've tagged with a cuisine · 35 distinct.
- 1. Italian22(11%)
- 2. Mexican15(7%)
- 3. Californian14(7%)
- 4. Japanese14(7%)
- 5. American14(7%)
- 6. Seafood13(6%)
- 7. Asian13(6%)
- 8. French12(6%)
Most-named dishes
Share of the 239 reviewed San Francisco restaurants that name each dish.
- 1. Oysters4(1.7%)
- 2. Coq au Vin3(1.3%)
- 3. Tiramisu3(1.3%)
- 4. Dungeness Crab Cakes3(1.3%)
- 5. Chicken Momo3(1.3%)
- 6. Burrata2(0.8%)
- 7. Chocolate Pot de Crème2(0.8%)
- 8. Shrimp and grits2(0.8%)
- 9. Queso Fundido2(0.8%)
- 10. Carbonara2(0.8%)
Standout San Francisco restaurants
The highest-scoring spots in our San Francisco coverage — each with a signature dish worth ordering.
What sets San Francisco apart
Cuisines over-represented in our San Francisco coverage compared with the national average across all 12 cities.
- Californian5.9% here vs 0.6% nationally9.73× national
- Asian5.4% here vs 1.1% nationally5.02× national
- Vegan2.1% here vs 1% nationally2.04× national
- Seafood5.4% here vs 2.8% nationally1.92× national
Where the reviews cluster
The San Francisco neighborhoods with the deepest editorial coverage.
How much it costs in San Francisco
Catalog-derivedPrice tier and Michelin recognition across 239 reviewed San Francisco spots. Secondary catalog signals, not editorial headline stats.
15.9% of the San Francisco restaurants we cover carry Michelin recognition (38 spots).
Explore San Francisco
About this data
Figures reflect TastyPals' editorial coverage of San Francisco (239 reviewed restaurants), not a census of every restaurant in the city. Cuisine counts exclude non-cuisine buckets; dish names are counted case-insensitively. Part of The State of Dining 2026. Free to cite with a link back — questions to hello@tastypals.com.